| Interpreting a diagram. |
1.
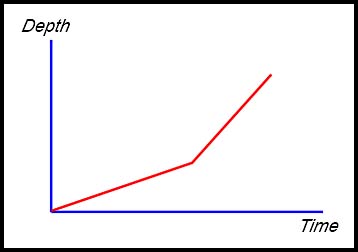
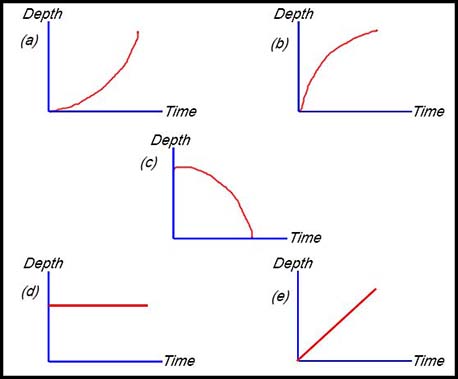
The graph above shows the depth of liquid in a symmetrical bottle against time when it is filling with liquid at a constant rate of 3 cm3 per sec.
The depth of the liquid is increasing at a constant rate and then it increases at a faster rate. Hence we are looking for a diagram in which the upper part of the flask is narrower than the base but the constancy of the rates requires both parts to have straight sides.
So the shape required is d.
|
| |
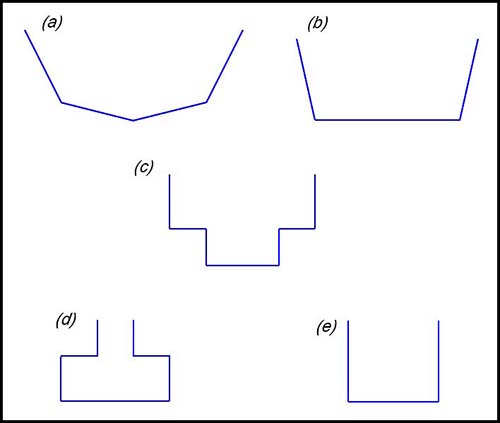
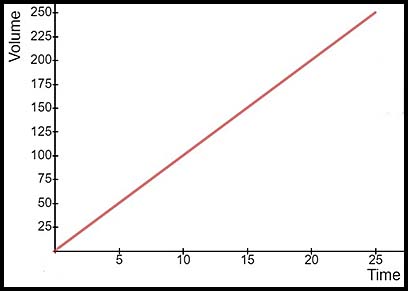
2. Water is poured into the 250 ml glass shown below at a constant rate of 10 ml/sec.
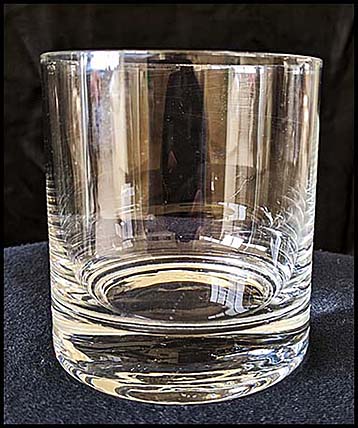
The glass has straight vertical sides and so the height of the water increases at a constant rate. Hence the volume increases at a constant rate also - as V = π r2h and the radius is constant.
Every 5 seconds, the volume increases 50 ml.
|
| |
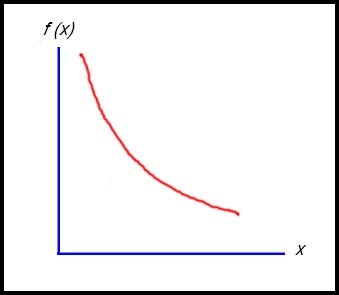
3.

Water is being poured into this glass (above the stem) at a constant rate.
Which of the following graphs describes the change in the water level over time?
The liquid is being poured into the glass at a constant rate.
The higher it rises in the glass, the further it has to spread out and so the depth increases at a decreasing rate.
Hence the answer is (b). |
| |
4. 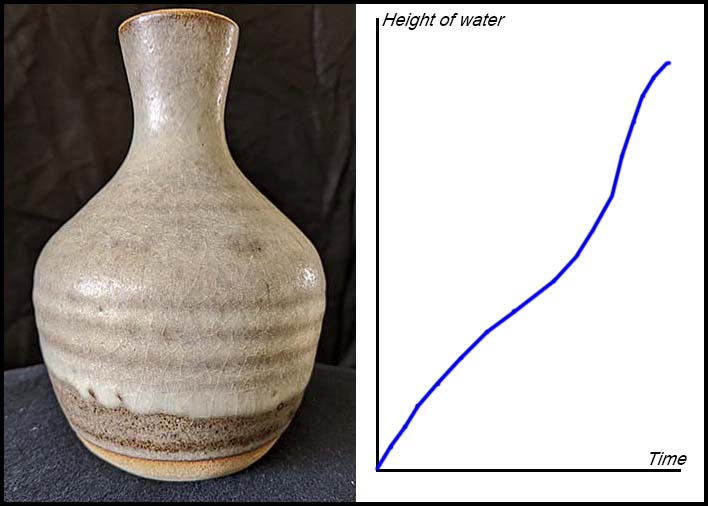
To fill the first half of the vase requires the water to spread out over an increasing area. Hence the additional height reached decreases continually.
During the third quarter, the vase is narrowing and hence the water cover less and less area meaning that it can increase height more quickly.
During the last quarter, the neck of the vase is increasing and so the water height increases at a decreasing rate.
|
| |
5. |
| Interpreting a graph. |
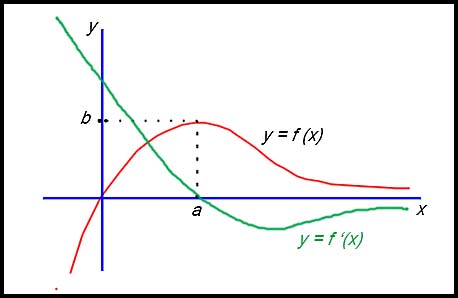
6. 
Note:
1. There is a stationary point at x = a so the derivative curve passes through the x axis at x = a.
2. For x < a, the gradient is positive and so the gradient function is graphed above the x axis.
3. As x increases with x > a, the y = f(x) value approaches the x axis and so the gradient is negative after x = a but progressively approaches zero. Hence the derivative curve approaches the x axis from underneath.
|
| |
7. The graph below represents y = f '(x). Values a, b, c, d and e are written along the x-axis.
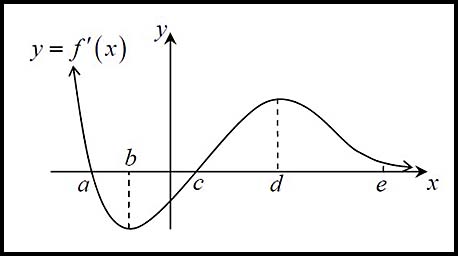
(i) A stationary point is where the first derivative = 0.
The graph of y = f (x) therefore has stationary points at
x = a and at x = c. Both of these points are also turning points because the gradient changes sign (here the curve crosses the x axis.
Also note that point x = a is a maximum SP as the gradient changes from positive to negative. At the point
x = c, there is a minimum SP as the gradient changes from negative to positive.
(ii) For what value(s) of x is the graph of y = f (x) increasing?
To be an increasing function, the gradient must be positive.
Hence the function is increasing for x < a and x > c.
(iii) When is the graph of y = f (x) concave up?
Concavity (f "(x)) is described by the gradient of the gradient function (i.e. by the second derivative).
For the original curve y = f(x) to have positive concavity, the gradient of the first derivative must be positive.
In the above graph, the gradient is positive for b < x < d.
(iv) Describe what happens to the graph of y = f (x)
as x→ ∞.
As x→ ∞, the gradient function shown by the graph → 0.
As the curve is coming from a minimum point, the function will be rising but at a decreasing rate. It will ultimately approach either the x axis or an asymptote (if there is one).
|
| |
8. The graph below shows the price of an ounce of gold over a
10 year period from May 2010 to May 2020.
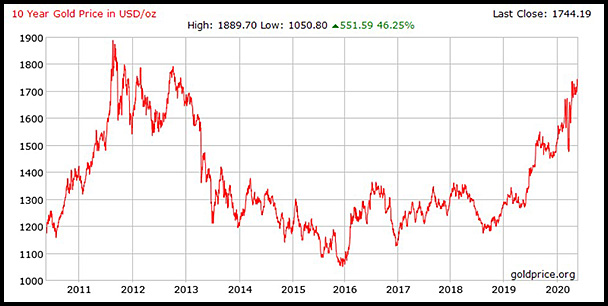
(i) concavity from about May 2010 to about September 2011;
The concavity is negative.
(ii) concavity from October 2012 to about June 2013;
The concavity is positive.
(iii) concavity from January 2016 to January 2017.
The concavity is negative.
|
| |
9. The cumulative number of COVID-19 cases in Australia to about 15 July:
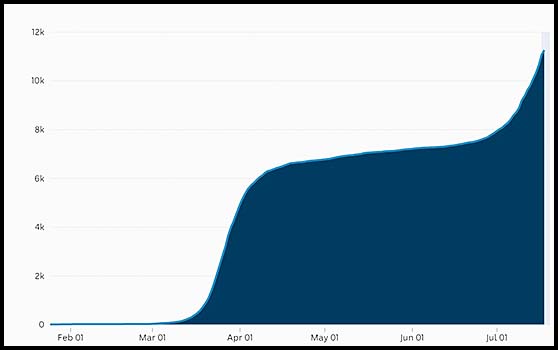
(i) Interpret the gradient of the curve up until about 4 March.
The gradient of the curve is very flat showing that the cumulative number of cases was reasonably constant at very few each day.
(ii) What does the graph indicate about the rate of change in the reported number of cases from about 1 April (i.e. what change was happening in the first derivative of this curve?).
The slope of the curve is positive and high indicating that the number of infections each day was high and increasing.
(iii) Compare the concavity of the curve on about 7 April with the concavity on about 1 July.
The concavity about 7 April is negative while the concavity about 1 July was positive. It appears therefore that the spread of COVID-19 was being controlled in April but there was another significant outbreak in early July.
(iv) Compare the rate of increase in the cumulative number of cases in the second half of March with the rate of increase after 1 July (i.e. compare the gradients of the curve in those two periods).
The gradients of these cumulative number graphs are about the same in the two time periods nominated. Hence the spread of the COVID-19 virus was at about the same rate.
|
| |
10.

Draw the derivative graph showing the pattern for the
rate of change in the number of cases by day. |
| Interpreting statements. |
11. 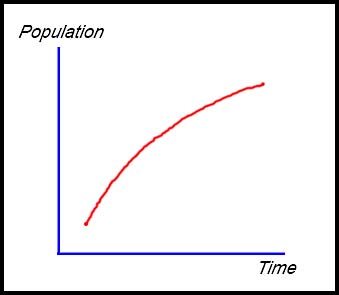
As the population is increasing, the gradient is positive.
As the rate is decreasing, the concavity must be negative. |
| |
12.
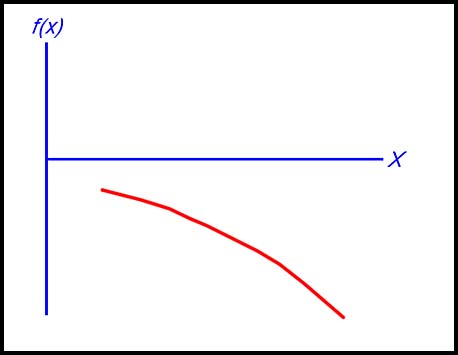
f (x) < 0 so the curve is below the x axis;
f '(x) < 0 so the gradient is always negative;
f "(x) < 0 so the curve is concave down.
|
| |
13. 
f(x) > 0 so the curve is above the x axis.
f '(x) < 0 so the gradient is negative.
f "(x) > 0 to the curve is concave up.
|
| |
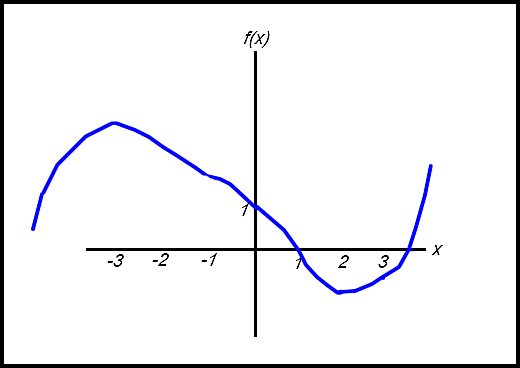
14. A function is defined as follows:
- when x = 0, y = 1;
- when x = -3, -1 and 2, f '(x) = 0;
- when x < -1, f"(x) < 0 and when x > 1, f "(x) > 0.
|
| |
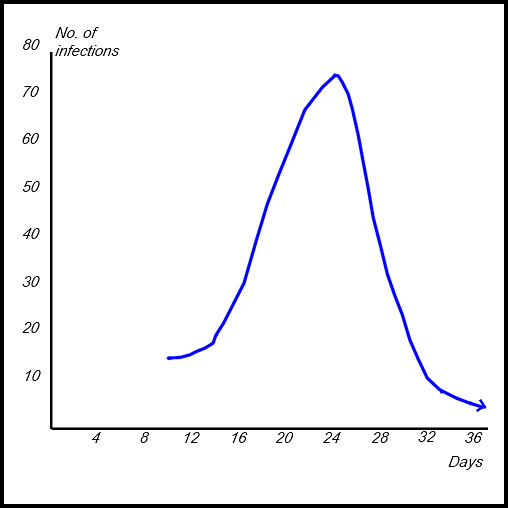
15. The graph of the number of corona virus infections in a given locality:
- begins at Day 10 with 15 infections and then increases slowly.
- after Day 16 (20 infection), the rate of infection begins to increase rapidly.
- a maximum of 75 people infected is reached on Day 24.
- thereafter the curve decreases at an increasing rate until Day 34 (when only 6 infections) and then the curve flattens.
|
| |
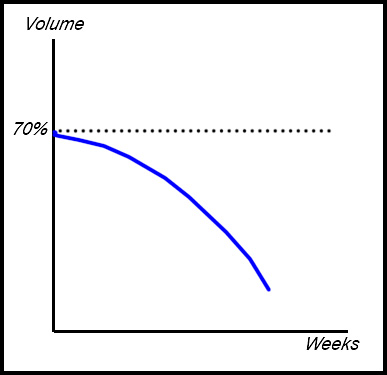
16. A dam in a particular rural area was at 70% capacity in the early stages of a prolonged drought. The volume V of water in this dam is monitored as a normal precaution over a period of time t. During the monitoring period, the volume decreased at an increasing rate due to the drought continuing over a long period.
(i) What comment does this statement make about the first and second derivatives?
The volume of water in the dam was decreasing over time and so the first derivative is negative.
The rate of loss of the water was increasing over time (hence water was being evaporated more quickly as time passed) - so the second derivative is negative (i.e. a negative concavity).
(ii)
|
| |
17. The median price of a house $P in a particular locality is falling at an increasing rate over 6 months from its maximum value in January due to the outbreak of a virus. After 6 months, the price continues to fall but more slowly.
- As the price continues to fall, the first derivative (ie the rate of change in the price) is negative throughout.
- As the rate at which the price falls becomes more rapid during the first 6 months, the second derivative (concavity of the graph) must be negative. After that period however, the rate of decrease reduces. Hence there is a horizontal point of inflection at 6 months and the concavity becomes positive although the first derivative is still negative (the median price is still falling).
|
| |
|